Agent-Zeitskala – Detailansicht
Die folgenden Berechtigungen:
- ui > supervisorAgentDetails > view
- Verzeichnis > Benutzer > Sicht
- Analytik > Benutzerdetails > Sicht
So zeigen Sie den Interaktionsabschnitt der Zeitleiste an:
- Analytik > Konversationsaggregat > Sicht
- Analytik > Gesprächsdetails > Sicht
Um die Metriken auszuwählen, benötigen Sie eines der folgenden:
- Analytik > Benutzeraggregat > Sicht
- Analytik > Konversationsaggregat > Sicht
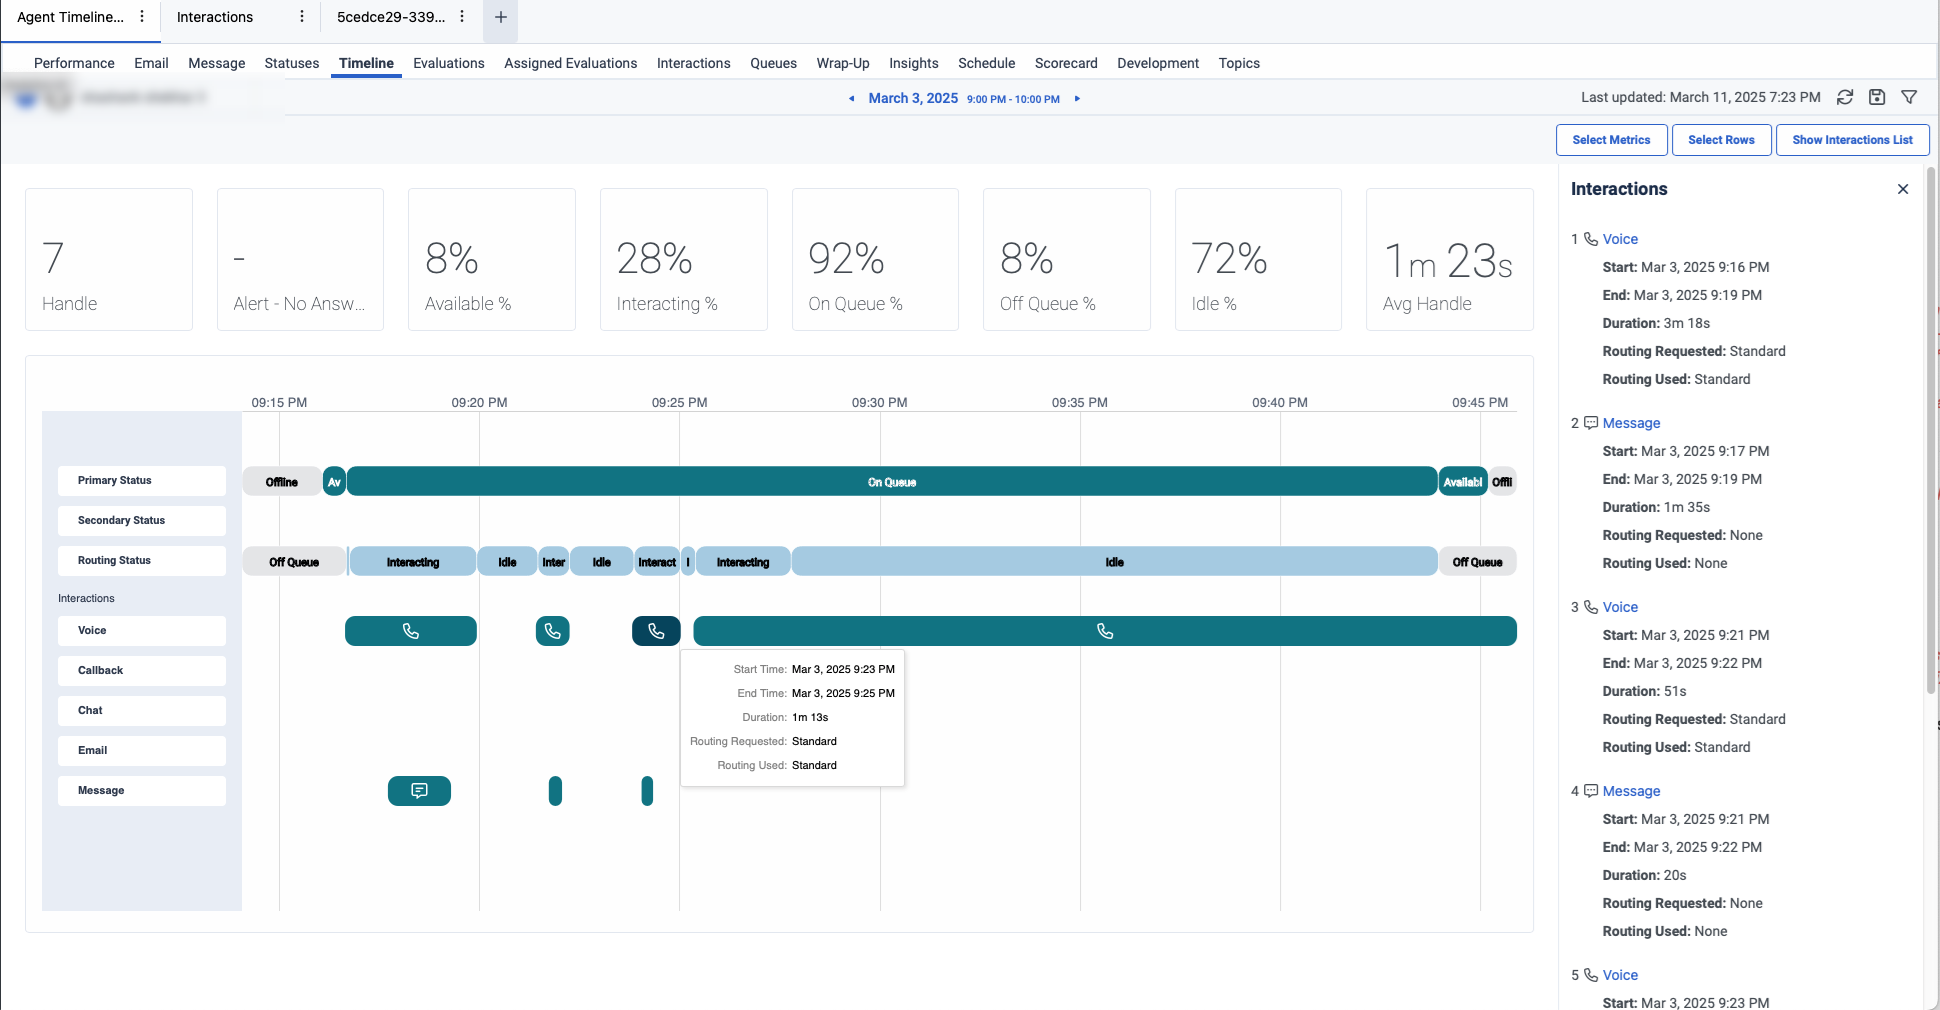
Die Detailansicht der Agenten-Zeitleiste bietet eine detaillierte visuelle Darstellung der von den Agenten geführten Gespräche. Diese Ansicht ermöglicht den Vorgesetzten einen besseren Einblick in die Aktivitäten der Agenten. Die Vorgesetzten können sehen, wie die Abfolge der von den Agenten abgewickelten Sprachgespräche mit der Überlappung mehrerer gleichzeitig stattfindender digitaler Interaktionen verwoben ist.
Standardmäßig bietet diese Ansicht Details zum Primärstatus, Sekundärstatus, Routingstatus und verschiedenen Interaktionen wie Sprache, Rückruf, Chat, E-Mail und Nachricht.
So zeigen Sie die Details der Agentenzeitleiste an:
- Klicken Leistung > Arbeitsplatz > Kontaktzentrum > Leistung des Agenten .
- Klicken Menü > Analyse > Analytics-Arbeitsbereich .
- Im Standard Abschnitt, suchen Sie nach Agentenleistung und klicken Sie dann auf den Ansichtsnamen, um ihn zu öffnen.
- Von der Ansicht „Zusammenfassung der Agentenleistung“ auf den Namen eines Agenten. Die Leistungsdetailansicht des Agenten wird angezeigt.
- Klicken Sie auf das Zeitleiste Tab. Die Detailansicht der Agentenzeitskala wird angezeigt.
Um die aktuellsten Daten zu sehen, klicken Sie auf Refresh
Zu Speichern Sie die Ansicht auf Ansicht speichern .
Sie können den Zeitbereich in der Zeitleiste vergrößern und verkleinern. Sie können beispielsweise sehen, dass im Datumswähler das Zeitintervall 21–22 Uhr am 3. März ausgewählt ist. Allerdings ist die Zeitleiste auf kurz vor 21:15 Uhr und kurz nach 21:45 Uhr vergrößert. Wenn Sie herauszoomen, können Sie die ganze Stunde von 21 bis 22 Uhr sehen. Wenn Sie auf weniger als eine Stunde herangezoomt haben, können Sie horizontal bis zur 21:00-Uhr-Grenze links und bis zur 22:00-Uhr-Grenze rechts scrollen.
Um im Windows-Betriebssystem hinein- und herauszuzoomen, können Sie die Strg-Taste gedrückt halten und mit der Maus oder dem Trackpad scrollen. Zum horizontalen Scrollen im Windows-Betriebssystem können Sie ein Trackpad verwenden.
Um im Mac OS-System hinein- und herauszuzoomen, können Sie die Befehlstaste (CMD) gedrückt halten und mit der Maus oder dem Trackpad scrollen. Um im Mac OS-System horizontal zu scrollen, können Sie die Umschalttaste gedrückt halten und mit Ihrer Maus oder Ihrem Trackpad scrollen.
- Die Zeitleiste zeigt keine Ergebnisse für den Primärstatus, den Sekundärstatus oder den Routing-Status an, wenn der Agent über längere Zeiträume inaktiv war.
- Sie können Daten nur für bis zu sieben Tage anzeigen.
- Wenn die Anzahl der Interaktionen innerhalb des ausgewählten Zeitraums mehr als 200 beträgt, wird oben eine Warnmeldung angezeigt und ein Link zur Ansichtsseite „Agenten-Interaktionsdetails“ bereitgestellt.
Anpassen der Ansicht
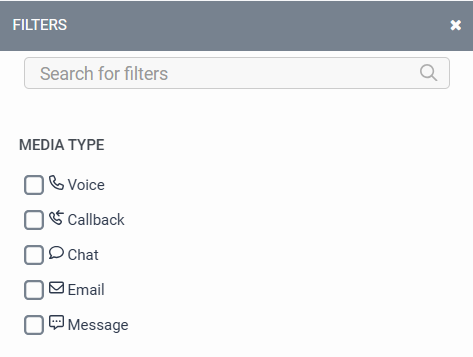
Um nur bestimmte Daten anzuzeigen, passen Sie die Detailansicht der Agentenzeitleiste an. Sie können beispielsweise nur bestimmte Messwerte anzeigen oder filtern, um bestimmte Interaktionstypen anzuzeigen.
Verwenden Sie zum Anpassen der Analyseansichten den Datumsfilter.
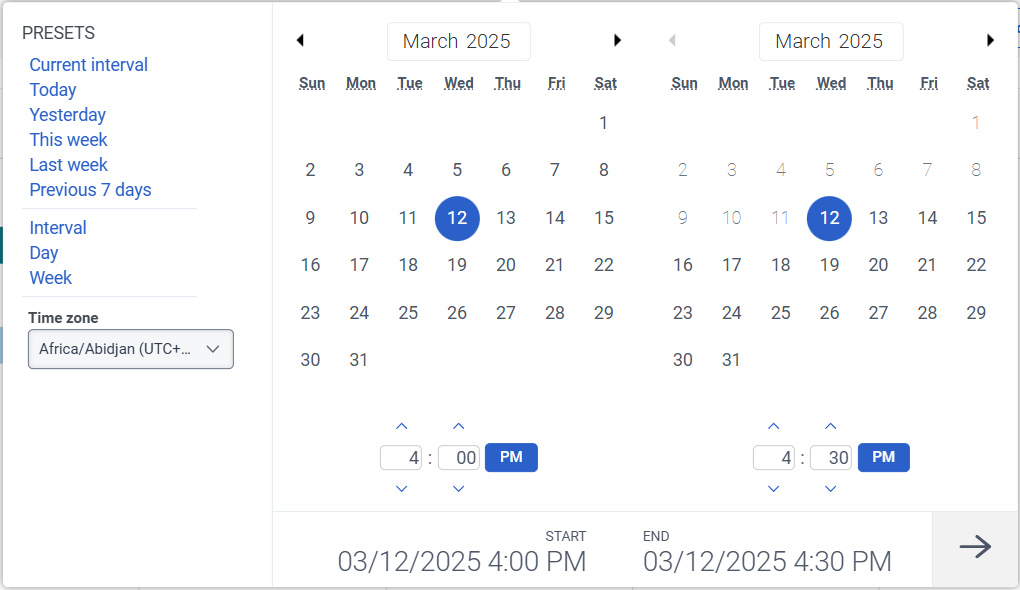
Verwenden Sie Voreinstellungen, um Metriken nach Datum zu filtern oder einen benutzerdefinierten Datumsbereich zu konfigurieren. Beim Filtern von Metriken für diese Ansicht Wählen Sie einen beliebigen Datumsbereich von bis zu 7 Tagen .
Um eine Voreinstellung zum Filtern von Metriken zu verwenden, führen Sie die folgenden Schritte aus:
- Um den Datumsfilter anzuzeigen, klicken Sie auf das Datum.
- Wählen Sie in der Liste Voreinstellungen eine voreingestellte Datumsoption aus.
Datumsvoreinstellungen
| Voreinstellungen | Beschreibung |
|---|---|
| Aktuelles Intervall | Zeigt Daten für den aktuellen 30-Minuten-Zeitraum an. |
| Heute | Zeigt Daten für den Zeitraum an, der das aktuelle Intervall umfasst. |
| Gestern | Zeigt die Daten des vorherigen Tages an. |
| Diese Woche | Zeigt Daten für einen Zeitraum von Sonntag bis Samstag an. |
| Letzte Woche | Zeigt die Daten der Vorwoche von Sonntag bis Samstag an. |
| Letzte 7 Tage | Zeigt die Daten der letzten sieben Tage an. |
| Intervall | Zeigt Daten für einen 30-minütigen Zeitraum an. |
| Tag | Zeigt Daten für einen einzelnen 24-Stunden-Tag an. |
| Woche | Zeigt Daten für einen Zeitraum von Sonntag bis Samstag an. |
Um einen benutzerdefinierten Datumsbereich zum Filtern von Metriken zu verwenden, führen Sie die folgenden Schritte aus:
- Klicken Sie auf das Datum, um den Datumsfilter anzuzeigen.
- Wählen Sie ein Start- und ein Enddatum im Kalender aus und klicken Sie auf den Filterpfeil .
Um Daten für einen anderen Zeitraum mit denselben Datumsvorgaben anzuzeigen, klicken Sie auf die Pfeile auf beiden Seiten der Datumsanzeige. ![]()
Um beispielsweise die Daten des Vortages anzuzeigen, klicken Sie auf die Voreinstellung Day und dann auf den Pfeil links neben dem Datum
Um Daten für eine andere Zeitzone mit denselben Datumsvoreinstellungen anzuzeigen, aus dem Zeitzone Wählen Sie im Dropdown-Menü die gewünschte Zeitzone aus. Sie können Berichte mit derselben ausgewählten Zeitzone erstellen und speichern.
So wählen Sie die Kennzahlen für die Zusammenfassungszeile aus:
- Klicken Metriken auswählen .
- Wählen Sie die gewünschten Metrikkategorien aus, wie beispielsweise Zählbasiert , Prozentbasiert , Und Zeitbasiert .
- Wählen Sie die gewünschte Metrik aus. Weitere Informationen zu den verfügbaren Metriken finden Sie im Agenten-Zeitleisten-Detailansicht im Artikel „Verfügbare Spalten in Leistungsansichten nach Kategorie anzeigen“.
Notiz : Sie können bis zu 12 Metriken auswählen. - Klicken Hinzufügen . Die ausgewählten Metriken werden angezeigt.
Eine konsolidierte Liste der verfügbaren Metriken in den Leistungsansichten finden Sie unter Konsolidierte Ansicht der verfügbaren Spalten in Leistungsansichten .
So blenden Sie die Zeilen der Zeitleiste ein oder aus:
- Klicken Zeilen auswählen . Der Zeilen auswählen Ein Popup-Fenster wird angezeigt.
- Wählen Sie die gewünschten Zeilen aus, z. B. Primärer Status , Sekundärstatus , Routing-Status , Und Interaktionen .
- Klicken Bestätigen . Die ausgewählten Zeilen werden auf der linken Seite angezeigt.
Um die Interaktionsliste ein- oder auszublenden, klicken Sie auf Interaktionsliste anzeigen .
Auf der rechten Seite werden alle Interaktionen für den gewählten Datumsbereich aufgelistet.
Um weitere Details zu einer Interaktion anzuzeigen, klicken Sie auf die gewünschte Interaktion. Sie werden zur Seite mit der Anzeige der Interaktionsdetails weitergeleitet.


